

178.1K
Downloads
204
Episodes
Your B2B analytics product does the hard technical work. So why aren't sales and adoption keeping up?
I'm Brian T. O'Neill, and my podcast, Experiencing Data, is a Listen Notes top 2% global podcast for founders, CEOs, and product leaders at B2B analytics companies: the ones whose product should be winning deals on technical sophistication alone, but isn't.
Maybe competitors have caught up on features and prospects say you all look the same, so you end up competing on price. Maybe customers never discover your best features and use you "like Excel." Maybe your value is algorithmic, and buyers can't see what they'd be paying for—something I call the Invisible Intelligence Gap.
Through solo episodes and interviews with CEOs, founders, and the enterprise data leaders who buy these products, I draw on my work as a product designer and strategy consultant to help you translate technical complexity into commercial clarity: connecting what your data product does to the outcomes, value, and human factors that still matter, even in the age of AI.
Experiencing Data is the only non-technical show about why technically impressive products don't sell or get used, and what to do about it.
Subscribe today on all major platforms or browse the episode archive.
Get 1-Page Episode Summaries In your Inbox:
https://designingforanalytics.com/ed
About Brian:
https://designingforanalytics.com/bio/
Episodes
Feb 25, 2020
Feb 25, 2020
41 min
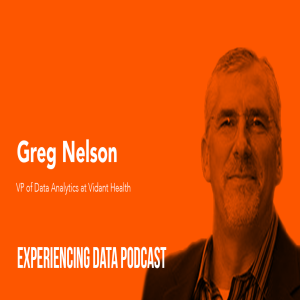
 Greg Nelson is VP of data analytics at Vidant Health, as well as an adjunct faculty member at Duke University. He is also the author of the “Analytics Lifecycle Toolkit,” which is a manual for integrating data management technologies. A data evangelist with over 20 years of experience in analytics and advisory, Nelson is widely known for his human-centered approach to analytics. In this episode, Greg and I explore what makes a data product or decision support application indispensable, specifically in the complex world of healthcare. In our chat, we covered:
- Seeing through the noise and identifying what really matters when designing data products
- The type of empathy training Greg and his COO are rolling out to help technical data teams produce more useful data products
- The role of data analytics product management and why this is a strategic skillset at Vidant
- The AI Playbook Greg uses at Vidant Health and their risk-based approach to assessing how they will validate the quality of a data product
- The process Greg uses to test and handle algorithmic bias and how this is linked to credibility in the data products they produce
- How exactly design thinking helps Greg’s team achieve better results, trust and credibility
- How Greg aligns workflows, processes, and best practice protocols when developing predictive models
Resources and Links:
Vidant Health Analytics Lifecycle Toolkit Greg Nelson’s article “Bias in Artificial Intelligence” Greg Nelson on LinkedIn Twitter: @GregorySNelson Video: Tuning a card deck for human-centered co-design of Learning Analytics
Quotes from Today's Episode
“We'd rather do fewer things and do them well than do lots of things and fail.”— Greg
“In a world of limited resources, our job is to make sure we're actually building the things that matter and that will get used. Product management focuses the light on use case-centered approaches and design thinking to actually come up with and craft the right data products that start with empathy.”— Greg
“I talk a lot about whole-brain thinking and whole-problem thinking. And when we understand the whole problem, the whole ‘why’ about someone's job, we recognize pretty quickly why Apple was so successful with their initial iPod.”— Greg
“The technical people have to get better [...] at extracting needs in a way that is understandable, interpretable, and really actionable, from a technology perspective. It's like teaching someone a language they never knew they needed. There's a lot of resistance to it.” — Greg
“I think deep down inside, the smart executive knows that you don’t bat .900 when you're doing innovation.” — Brian
“We can use design thinking to help us fail a little bit earlier, and to know what we learned from it, and then push it forward so that people understand why this is not working. And then you can factor what you learned into the next pass.” — Brian
“If there's one thing that I've heard from most of the leaders in the data and analytics space, with regards particularly to data scientists, it’s [the importance of] finding this “other” missing skill set, which is not the technical skillset. It's understanding the human behavioral piece and really being able to connect the fact that your technical work does have this soft skill stuff.” — Brian
“At the end of the day, I tell people our mission is to deliver data that people can trust in a way that's usable and actionable, built on a foundation of data literacy and dexterity. That trust in the first part of our core mission is essential.”— Greg
Feb 11, 2020
Feb 11, 2020
39 min
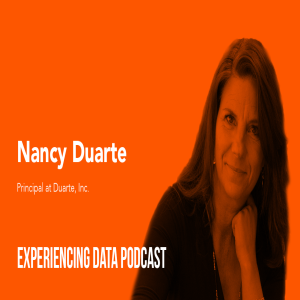
Nancy Duarte is a communication expert and the leader of the largest design firm in Silicon Valley, Duarte, Inc. She has more than 30 years of experience working with global companies and counts eight of the top ten Fortune 500 brands in her clientele. She is the author of six books, and her work as appeared in Fortune, Time Magazine, Forbes, Wired, Wall Street Journal, New York Times, Los Angeles Times, Cosmopolitan Magazine, and CNN.
In this episode, Nancy and I discussed some of the reasons analytics and data experts fail to effectively communicate the insights and value around data. She drew from her key findings in her work as a communication expert that she details in her new book, Data Story, and the importance of communicating data through the natural structure of storytelling.
In our chat, we covered:
- How empathy is tied to effective communication.
- Biases that cloud our own understanding of our communication skills
- How to communicate an enormous amount of data effectively and engagingly
- What’s wrong with sharing traditional presentations as a reading asset and Nancy’s improved replacement for them in the enterprise
- The difference in presenting data in business versus scientific settings
- Why STEAM, not STEM, is relevant to effective communication for data professionals and what happens when creativity and communication aren’t taught
- How the brain reacts differently when it is engaged through a story
Resources and Links:
Quotes from Today’s Episode
“I think the biggest struggle for analysts is they see a lot of data.” —Nancy
“In a business context, the goal is not to do perfect research most of the time. It’s actually to probably help inform someone else’s decision-making.” —Nancy
“Really understand empathy, become a bit of a student of story, and when you start to apply.” these, you’ll see a lot of traction around your ideas.” — Nancy
“We’ve gone so heavily rewarded the analytical mindset that now we can’t back out of that and be dual-modal about being an analytical mindset and then also really having discipline around a creative mindset.” — Nancy
“There’s a bunch of supporting data, but there’s also all this intuition and other stuff that goes into it. And so I think just learning to accept the ambiguity as part of that human experience, even in business.” — Brian
“If your software application doesn’t produce meaningful decision support, then you didn’t do anything. The data is just sitting there and it’s not actually activating.” — Brian
“People can’t draw a direct line from what art class or band does for you, and it’s the first thing that gets cut. Then we complain on the backend when people are working in professional settings that they can’t talk to us.” — Brian
Jan 28, 2020
Jan 28, 2020
41 min
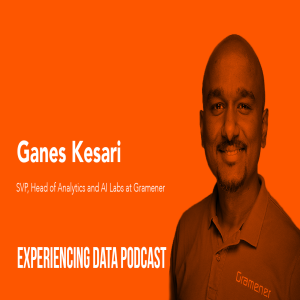
 Ganes Kesari is the co-founder and head of analytics and AI labs at Gramener, a software company that helps organizations tell more effective stories with their data through robust visualizations. He’s also an advisor, public speaker, and author who talks about AI in plain English so that a general audience can understand it. Prior to founding Gramener, Ganes worked at companies like Cognizant, Birlasoft, and HCL Technologies serving in various management and analyst roles.
Join Ganes and I as we talk about how design, as a core competency, has enabled Gramener’s analytics and machine learning work to produce better value for clients. We also touched on:
- Why Ganes believes the gap between the business and data analytics organizations is getting smaller
- How AI (and some other buzzwords) are encouraging more and more investments in understanding data
- Ganes’ opinions about the “analytics translator” role
- How companies might think they are unique for not using “traditional agile”—when in fact that’s what everyone is doing
- Ganes’ thoughts on the similarities of use cases across verticals and the rise of verticalized deep data science solutions
- Why Ganes believes organizations are increasingly asking for repeatable data science solutions
- The pivotal role that empathy plays in convincing someone to use your software or data model
- How Ganes’ team approaches client requests for data science projects, the process they follow to identify use cases for AI, and how they use AI to identify the biggest business problem that can be solved
- What Ganes believes practitioners should consider when moving data projects forward at their organizations
Resources and Links
Ganes Kesari on Twitter: @Kesaritweets
Ganes Kesari on LinkedIn: https://www.linkedin.com/in/ganes-kesari/
Quotes from Today’s Episode
“People tend to have some in-house analytics capability. They’re reaching out for design. Then it’s more of where people feel that the adoption hasn’t happened. They have that algorithm but no one understands its use. And then they try to buy some license or some exploratory visualization tools and they try their hand at it and they’ve figured out that it probably needs a lot more than some cute charts or some dashboards. It can’t be an afterthought. That’s when they reach out.” — Ganes
“Now a lot more enquiries, a lot more engagements are happening centrally at the enterprise level where they have realized the need for data science and they want to run it centrally so it’s no longer isolated silos.” — Ganes
“I see that this is a slightly broader movement where people are understanding the value of data and they see that it is something that they can’t avoid or they can’t prioritize it lower anymore.“ — Ganes
“While we have done a few hundred consulting engagements and help with bespoke solutions, there is still an element of commonality. So that’s where we abstracted some of those, the common or technology requirements and common solutions into our platform.” — Ganes
“My general perception is that most data science and analytics firms don’t think about design as a core competency or part of analytics and data science—at least not beyond perhaps data visualization.” —Brian
“I was in a LinkedIn conversation today about this and some comments that Tom Davenport had made on this show a couple of episodes ago. He was talking about how we need this type of role that goes out and understands how data is used and how systems and software are used such that we can better align the solutions with what people are doing. And I was like, ‘amen.’ That’s actually not a new role though; it’s what good designers do!” — Brian
Jan 14, 2020
Jan 14, 2020
51 min
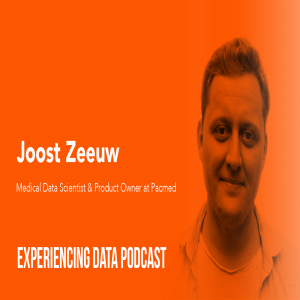
 Joost Zeeuw is a data scientist and product owner at Pacmed, a data-driven healthcare and AI startup in Amsterdam that combines medical expertise and machine learning to create stronger patient outcomes and improve healthcare experiences. He’s also taught a number of different subjects—like physics, chemistry, and mathematics—at Lyceo, an online education service, and Luzac College in the Netherlands.
Join Brian and Joost as they discuss the role of design and user experience within the context of providing personalized medical treatments using AI. Plus:
- The role data has in influencing doctors’ decisions—without making the decisions
- The questions Joost’s product team asks before designing any AI solution at Pacmed
- How people’s familiarity with iPhones and ease-of-use has influenced expectations around simplicity—and the challenges this poses when there is machine learning under the hood
- Why Brian thinks Pacmed’s abnormal approach to design is great—and what that approach looks like
- The simple, non-technical, but critical thing Pacmed did early on to help them define their AI product strategy and avoid going down the wrong path
- An example of an unexpected treatment prediction that Pacmed’s algorithm detected—which ended up being something that a specific field of medicine had been studying with classical research techniques 10,000 km away
- Where Joost believes Western medicine falls short with respect to new drug trials
Resources and Links
Quotes for Today’s Episode
“Pacmed in that has a three-fold mission, which is, first of all, to try to make sure that every single patient gets the treatment that has proven to work for him or her based on prior data analysis. And next to that we say, ‘well, if an algorithm can learn all these awesome insights generated by thousands and thousands of doctors, then a doctor using one of those products is also very capable of learning more and more things from the lessons that are incorporated in this algorithm and this product.’ And finally, healthcare is very expensive. We are trying to maximize the efficiency and the effectiveness of that spend by making sure everybody gets a treatment that has the highest probability of working for him or her.” — Joost
“Offering a data product like this is really another tool in that toolbox that allows the doctor to pierce through this insane amount of complexity that there is in giving care to a patient.” — Joost
“Before designing anything, we ask ourselves this: Does it fit into the workflow of people that already have maybe one of the most demanding jobs in the world?” — Joost
“There’s a very big gap between what is scientifically medically interesting and what’s practical in a healthcare system.” — Joost
“When I talk about design here, I’m talking kind of about capital D design. So product design, user experience, looking at the whole business and the outcomes we’re trying to drive, it’s kind of that larger picture here.” — Brian
“I don’t think this is ‘normal’ for a lot of people coming from the engineering side or from the data science side to be going out and talking to customers, thinking about like how does this person do their job and how does my work fit into you know a bigger picture solution of what this person needs to do all day, and what are the health outcomes we’re going for? That part of this product development process is not about data science, right? It’s about the human factors piece, about how does our solution fit into this world.” — Brian
“I think that the impact of bringing people out into the field—whatever that is, that could be a corporate cubicle somewhere, a hospital, outside in a farm field—usually there’s a really positive thing that happens because I think people are able to connect their work with an actual human being that’s going to potentially use this solution. And when we look at software all day, it’s very easy to disconnect from any sense of human connection with someone else.” — Brian
“If you’re a product owner or even if you’re more on the analytics side, but you’re responsible for delivering decision support, it’s really important to go get a feel for what people are doing all day.” — Brian
Dec 31, 2019
Dec 31, 2019
45 min
 Di Dang is an emerging tech design advocate at Google and helped lead the creation of Google’s People + AI Guidebook. In her role, she works with product design teams, external partners, and end users to support the creation of emerging tech experiences. She also teaches a course on immersive technology at the School of Visual Concepts. Prior to these positions, Di worked as an emerging tech lead and senior UX designer at POP, a UX consultant at Kintsugi Creative Solutions, and a business development manager at AppLift. She earned a bachelor of arts degree in philosophy and religious studies from Stanford University.
Join Brian and Di as they discuss the intersection of design and human-centered AI and:
- Why a data science leader should care about design and integrating designers during a machine-learning project, and the impacts when they do not
- What exactly Di does in her capacity as an emerging tech design advocate at Google and the definition of human-centered AI
- How design helps data science teams save money and time by elucidating the problem space and user needs
- The two key purposes of Google’s People + AI Research (PAIR) team
- What Google’s triptych methodology is and how it helps teams prevent building the wrong solution
- A specific example of how user research and design helped ship a Pixel 2 feature
- How to ensure an AI solution is human-centered when a non-tech company wants to build something but lacks a formal product manager or UX lead/resource
- The original goals behind the creation of Google’s People + AI Guidebook
- The role vocabulary plays in human-centered AI design
Resources and Links
Twitter: @Dqpdang
Quotes from Today’s Episode
“Even within Google, I can’t tell you how many times I have tech leaders, engineers who kind of cock an eyebrow at me and ask, ‘Why would design be involved when it comes to working with machine learning?’” — Di
“Software applications of machine learning is a relatively nascent space and we have a lot to learn from in terms of designing for it. The People + AI Guidebook is a starting point and we want to understand what works, what doesn’t, and what’s missing so that we can continue to build best practices around AI product decisions together.” — Di
“The key value proposition that design brings is we want to work with you to help make sure that when we’re utilizing machine learning, that we’re utilizing it to solve a problem for a user in a way that couldn’t be done through other technologies or through heuristics or rules-based programming—that we’re really using machine learning where it’s most needed.” — Di
“A key piece that I hear again and again from internal Google product teams and external product teams that I work with is that it’s very, very easy for a lot of teams to default to a tech-first kind of mentality. It’s like, ‘Oh, well you know, machine learning, should we ML this?’ That’s a very common problem that we hear. So then, machine learning becomes this hammer for which everything is a nail—but if only a hammer were as easy to construct as a piece of wood and a little metal anvil kind of bit.” — Di
“A lot of folks are still evolving their own mental model around what machine learning is and what it’s good for. But closely in relation—because this is something that I think people don’t talk as much about maybe because it’s less sexy to talk about than machine learning—is that there are often times a lot of organizational or political or cultural uncertainties or confusion around even integrating machine learning.” — Di
“I think there’s a valid promise that there’s a real opportunity with AI. It’s going to change businesses in a significant way and there’s something to that. At the same time, it’s like go purchase some data scientists, throw them in your team, and have them start whacking stuff. And they’re kind of waiting for someone to hand them a good problem to work on and the business doesn’t know and they’re just saying, ‘What is our machine learning strategy?’ And so someone in theory hopefully is hunting for a good problem to solve.” — Brian
“Everyone’s trying to move fast all the time and ship code and a lot of times we focus on the shipping of code and the putting of models into production as our measurement—as opposed to the outcomes that come from putting something into production.” — Brian
“The difference between the good and the great designer is the ability to merge the business objectives with ethically sound user-facing and user-centered principles.” — Brian
Dec 17, 2019
Dec 17, 2019
50 min
 When it comes to telling stories with data, Cole Nussbaumer Knaflic is ahead of the curve. In October 2015, she wrote a best-selling book called storytelling with data: a data visualization guide for business professionals. That book led to the creation of storytelling with data, an agency that helps businesses communicate more effectively using data, and she’s since followed-up with another best-seller: storytelling with data: let’s practice! Prior to her current role, Cole served as a people analytics manager at Google, was the owner and chief consultant at Insight Analytics, and held several positions at Washington Mutual, among other positions.
In our chat, we covered:
- Why sharp communication skills are integral to telling stories with data
- The skills data people need to effectively communicate with data
- Who Cole thinks you should run your presentations by first, and the specific colleagues you should be sharing them with
- Why it’s important to practice presentations in informal settings first
- How looking at data in different formats can help you build more effective presentations
- The differences between exploratory and explanatory data analysis in the context of storytelling
- The important role of diction when presenting data
- Cole’s opinions on the skills many modern workers need around data storytelling
- Why data visualization and the ability to tell stories is not a nice-to-have skill
- What Cole’s approach to preparing for a presentation looks like and the format she uses to kick off the process
Resources and Links
Designingforanalytics.com/seminar
Twitter: @Storywithdata.
Company website: Storytellingwithdata.com
Quotes from Today’s Episode
“I've always really enjoyed that space where numbers and business intersect and enjoy how we can use numbers to get to understand things better and make smarter decisions.” — Cole
“If you're the one analyzing the data, you know it best. And you're actually in a unique position to be able to derive and help others derive greater value from that data. But in order to do that, you have to be able to talk to other people about it and communicate what you've done to technical audiences and to non-technical audiences.” — Cole
“When it comes to communicating effectively with data, you can't take out the human part. That's the part where things can either succeed or fail.” — Cole
“There's no single right way to show data. Any data can be graphed a ton of different ways. And so when we're thinking about how we visualize our data, it really means stepping back and thinking about what sort of behavior we’re trying to drive in our audience. What do we want them to see in this? And then it often means iterating through different views of the data, which is also a fantastic way just to get to know your data better because different views will make observations easier or less easy to see.” — Cole
“As soon as we try to draw attention to one aspect of the data or another, it actually makes any other potential takeaways harder to see.” — Cole
“Words are very important for making our data accessible and understandable.” — Cole
“Depending on the visualization, what you're doing is you're teaching yourself not to assume that the information is necessarily clear. You're being objective. And it sounds like a dumb question, but that's kind of what I usually recommend to my clients: We need to be really objective about our assumptions about what's being communicated here and validate that.” — Brian
“The low-fidelity format—especially if you're working with a stakeholder or perhaps someone who's going to be the recipient—enables them to give you honest feedback. Because the more polished that sucker looks, the less they're going to want to give you any.” — Brian
Dec 3, 2019
Dec 3, 2019
47 min
 Angela Bassa is the director of data science and head of data science and machine learning at iRobot, a technology company focused on robotics (you might have clean floors thanks to a Roomba). Prior to joining iRobot, Angela wore several different hats, including working as a financial analyst at Morgan Stanley, the senior manager of big data analytics and platform engineering at EnerNOC, and even a scuba instructor in the U.S. Virgin Islands.
Join Angela and I as we discuss the role data science plays in robotics and explore:
- Why Angela doesn’t believe in a division between technical and non-technical skill
- Why Angela came to iRobot and her mission
- What data breadcrumbs are and what you should know about them
- The skill Angela believes matters most when turning data science into a producer of decision support
- Why the last mile of the UX is often way longer than one mile
- The critical role expectation management plays in data science, how Angela handles delivering surprise findings to the business, and the marketing skill she taps to help her build trust
Resources and Links
Designing for Analytics Seminar
Quotes from Today’s Episode
“Because these tools that we use sometimes can be quite sophisticated, it’s really easy to use very complicated jargon to impart credibility onto results that perhaps aren’t merited. I like to call that math-washing the result.” — Angela
“Our mandate is to make sure that we are making the best decisions—that we are informing strategy rather than just believing certain bits of institutional knowledge or anecdotes or trends. We can actually sort of demonstrate and test those hypotheses with the data that is available to us. And so we can make much better informed decisions and, hopefully, less risky ones.” — Angela
“Data alone isn’t the ground truth. Data isn’t the thing that we should be reacting to. Data are artifacts. They’re breadcrumbs that help us reconstruct what might have happened.” — Angela
[When getting somebody to trust the data science work], I don’t think the trust comes from bringing someone along during the actual timeline. I think it has more to do with bringing someone along with the narrative.—Angela
“It sounds like you’ve created a nice dependency for your data science team. You’re seen as a strategic partner as opposed to being off in the corner doing cryptic work that people can’t understand.” — Brian
“When I talk to data scientists and leaders, they often talk about how technical skills are very easy to measure. You can see them on paper, you can get them in the interview. But there are these other skills that are required to do effective work and create value.” — Brian
Nov 19, 2019
Nov 19, 2019
47 min
 Tom Davenport has literally written the book on analytics. Actually, several of them, to be precise. Over the course of his career, Tom has established himself as the authority on analytics and how their role in the modern organization has evolved in recent years. Tom is a distinguished professor at Babson College, a research fellow at the MIT Initiative on the Digital Economy, and a senior advisor at Deloitte Analytics. The discussion was timely as Tom had just written an article about a financial services company that had trained its employees on human-centered design so that they could ensure any use of AI would be customer-driven and valuable. We discussed their journey and:
- Why on a scale of 1-10, the field of analytics has only gone from a one to about a two in ten years time
- Why so few analytics projects actually make it into production
- Examples of companies who are using design to turn data into useful applications of AI, decision support and product improvements for customers
- Why shadow IT shouldn’t be a bad word
- AI moonshot projects vs. MVPs and how they relate
- Why journey mapping is incredibly useful and important in analytics and data science work
- How human-centered design and ethnography is the tough work that’s required to turn data into decision support
- Tom’s new book and his thoughts on the future of data science and analytics
Resources and Links:
- Website: Tomdavenport.com
- LinkedIn: Tom Davenport
- Twitter: @tdav
- Designingforanalytics.com/seminar
- Designingforanalytics.com
Quotes from Today’s Episode
“If you survey organizations and ask them, ‘Does your company have a data-driven culture?’ they almost always say no. Surveys even show a kind of negative movement over recent years in that regard. And it's because nobody really addresses that issue. They only address the technology side.” — Tom Eventually, I think some fraction of [AI and analytics solutions] get used and are moderately effective, but there is not nearly enough focus on this. A lot of analytics people think their job is to create models, and whether anybody uses it or not is not their responsibility...We don't have enough people who make it their jobs to do that sort of thing. —Tom I think we need this new specialist, like a data ethnographer, who could sort of understand much more how people interact with data and applications, and how many ways they get screwed up.—Tom I don't know how you inculcate it or teach it in schools, but I think we all need curiosity about how technology can make us work more effectively. It clearly takes some investment, and time, and effort to do it.— Tom TD Wealth’s goal was to get [its employees] to experientially understand what data, analytics, technology, and AI are all about, and then to think a lot about how it related to their customers. So they had a lot of time spent with customers, understanding what their needs were to make that match with AI. [...] Most organizations only address the technology and the data sides, so I thought this was very refreshing.—Tom “So we all want to do stuff with data. But as you know, there are a lot of poor solutions that get provided from technical people back to business stakeholders. Sometimes they fall on deaf ears. They don't get used.” — Brian “I actually had a consultant I was talking to recently who said you know the average VP/director or CDO/CAO has about two years now to show results, and this gravy train may be slowing down a little bit.“ — Brian “One of the things that I see in the kind of the data science and analytics community is almost this expectation that ‘I will be handed a well-crafted and well-defined problem that is a data problem, and then I will go off and solve it using my technical skills, and then provide you with an answer.’” — Brian
Nov 5, 2019
Nov 5, 2019
39 min
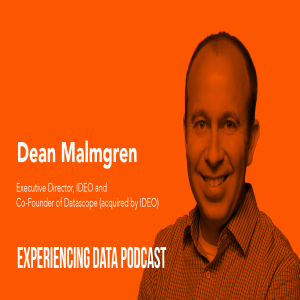
 Dean Malmgren cut his teeth as a chemical and biological engineer. In grad school, he studied complex systems and began telling stories about them through the lens of data algorithms. That led him to co-found Datascope Analytics, a data science consulting company which was purchased by IDEO, a global design firm. Today, Dean is an executive director at IDEO and helps teams use data to build delightful products and experiences.
Join Dean and I as we explore the intersection of data science and design and discuss:
- Human-centered design and why it’s important to data science
- What it was like for a data science company to get ingested into a design firm and why it’s a perfect match
- Why data science isn’t always good at creating things that have never existed before
- Why teams need to prototype rapidly and why data scientists should hesitate to always use the latest tools
- What data scientists can learn from design team and vice-versa
- Why data scientists need to talk to end users early and often, and the importance of developing empathy
- The difference between data scientists and algorithm designers
- Dean’s opinions on why many data analytics projects fail
Resources and Links
Quotes from Today’s Episode
“One of the things that we learned very, very quickly, and very early on, was that designing algorithms that are useful for people involves a lot more than just data and code.” — Dean
“In the projects that we do at IDEO, we are designing new things that don’t yet exist in the world. Designing things that are new to the world is pretty different than optimizing existing processes or business units or operations, which tends to be the focus of a lot of data science teams.” — Dean
“The reality is that designing new-to-the-world things often involves a different mindset than optimizing the existing things.” — Dean
“You know if somebody rates a movie incorrectly, it’s not like you’d throw out Siskel and Ebert’s recommendations for the rest of your life. You just might not pay as much attention to them. But that’s very different when it comes to algorithmic recommendations. We have a lot less tolerance for machines making mistakes.” — Dean
“The key benefit here is the culture that design brings in terms of creating early and getting feedback early in the process, as opposed to waiting you know three, five, six, seven months working on some model, getting it 97% accurate but 10% utilized.” — Brian
“You can do all the best work in the world. But at the end of the day, if there’s a human in the loop, it’s that last mile or last hundred feet, whatever you want to call it, where you make it or break it.” — Brian
“Study after study shows that 10 to 20% of big data analytics projects and AI projects succeed. I’ve actually been collecting them as a hobby in a single article, because they keep coming out.” — Brian
Oct 22, 2019
Oct 22, 2019
35 min
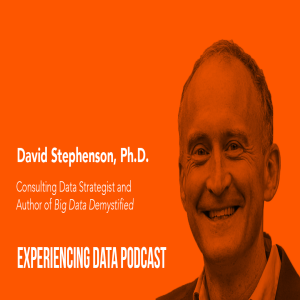
 David Stephenson, Ph.D., is the author of Big Data Demystified, a guide for executives that explores the transformative nature of big data and data analytics. He’s also a data strategy consultant and professor at the University of Amsterdam. In a previous life, David worked in various data science roles at companies like Adidas, Coolblue, and eBay.
Join David and I as we discuss what makes data science projects succeed and explore:
- The non-technical issues that lead to ineffective data science and analytics projects
- The specific type of communication that is critical to the success of data science and analytics initiatives (and how working in isolation from your stakeholder or business sponsor creates risk))
- The power of showing value early, starting small/lean, and one way David applies agile to data science projects
- The problems that emerge when data scientists only want to do “interesting data science”
- How design thinking can help data scientists and analytics practitioners make their work resonate with stakeholders who are not “data people”
- How David now relies on design thinking heavily, and what it taught him about making “cool” prototypes nobody cared about
- What it’s like to work on a project without understanding who’s sponsoring it
Resources and Links
Connect with David on LinkedIn
David’s book: Big Data Demystified
Quotes from Today’s Episode
“You see a lot of solutions being developed very well, which were not designed to meet the actual challenge that the industry is facing.” — David
“You just have that whole wasted effort because there wasn’t enough communication at inception.” — David
“I think that companies are really embracing agile, especially in the last few years. They’re really recognizing the value of it from a software perspective. But it’s really challenging from the analytics perspective—partly because the data science and analytics. They don’t fit into the scrum model very well for a variety of reasons.” — David
“That for me was a real learning point—to understand the hardest thing is not necessarily the most important thing.” — David
“If you’re working with marketing people, an 80% solution is fine. If you’re working with finance, they really need exact numbers. You have to understand what your target audience needs in terms of precision.” — David
“I feel sometimes that when we talk about “the business” people don’t understand that the business is a collection of people—just like a government is a collection of real humans doing jobs and they have goals and needs and selfish interests. So there’s really a collection of end customers and the person that’s paying for the solution.” — Brian
“I think it’s always important—whether you’re a consultant or you’re internal—to really understand who’s going to be evaluating the value creation.”— Brian
“You’ve got to keep those lines of communication open and make sure they’re seeing the work you’re doing and evaluating and giving feedback on it. Throw this over the wall is a very high risk model.” — Brian