

178.2K
Downloads
204
Episodes
Your B2B analytics product does the hard technical work. So why aren't sales and adoption keeping up?
I'm Brian T. O'Neill, and my podcast, Experiencing Data, is a Listen Notes top 2% global podcast for founders, CEOs, and product leaders at B2B analytics companies: the ones whose product should be winning deals on technical sophistication alone, but isn't.
Maybe competitors have caught up on features and prospects say you all look the same, so you end up competing on price. Maybe customers never discover your best features and use you "like Excel." Maybe your value is algorithmic, and buyers can't see what they'd be paying for—something I call the Invisible Intelligence Gap.
Through solo episodes and interviews with CEOs, founders, and the enterprise data leaders who buy these products, I draw on my work as a product designer and strategy consultant to help you translate technical complexity into commercial clarity: connecting what your data product does to the outcomes, value, and human factors that still matter, even in the age of AI.
Experiencing Data is the only non-technical show about why technically impressive products don't sell or get used, and what to do about it.
Subscribe today on all major platforms or browse the episode archive.
Get 1-Page Episode Summaries In your Inbox:
https://designingforanalytics.com/ed
About Brian:
https://designingforanalytics.com/bio/
Episodes
Jan 3, 2019
Jan 3, 2019
1 hr 44 sec
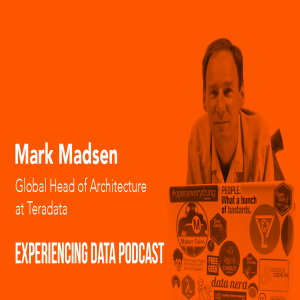
 In Episode #003, I talked to Mark Madsen of Teradata on the common interests of analytics software architecture and product design. Mark spent most of the past 25 years working in the analytics field, and he is currently the global head of architecture for Teradata Consulting. He is a true analytics pioneer and a regular international speaker who also chairs several conferences and is on the O’Reilly Strata, Accelerate, and TDWI conference committees. If I only looked at job titles, Mark would be an odd fit for Experiencing Data, but the reality is that Mark has many of the traits of a good design thinker including a good sense of empathy about what users need in the world of analytics and decision support software. It’s a rare combination in my experience, so I hope you enjoy the interview. Besides, Mark is also highly entertaining

Dec 4, 2018
Dec 4, 2018
44 min
 Julie Yoo is the co-founder of Kyruus, a medical technology company that is the developer of ProviderMatch. One of the most frustrating things about the healthcare system is the tendency for patients to be sent to the wrong type of doctor for their health issue. The industry term for this problem is patient access paradox.
ProviderMatch is software that directs patients to the proper medical specialist for their specific needs.
During today’s episode, Julie and I discuss the components that make ProviderMatch an effective tool. Some of the topics we touch on are:
- How ProviderMatch has changed the customer service side of healthcare.
- How ProviderMatch helps combat physician burnout.
- The 3 major user bases served by the application.
- The 3 types of tests Kyruus uses to test new and upgraded product features.
- The 3 levels of analytics that Kyruus uses to measure RIO and value.
Resources and Links:
- Kyruus
- Kyruus on Facebook
- Kyruus on LinkedIn
- Kyruus on Twitter
- Julie Yoo on Twitter
- Julie Yoo on LinkedIn
Thank you for joining us for today’s episode of Experiencing Data. Keep coming back for more episodes with great conversations about the world through the lens of analytics and design.
Nov 21, 2018
Nov 21, 2018
38 min
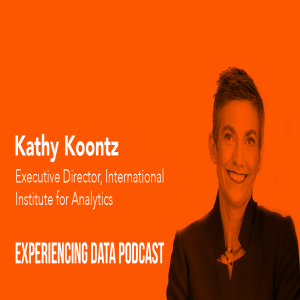
 Kathy Koontz is the Executive Director of the Analytics Leadership Consortium at the International Institute for Analytics and my guest for today’s episode. The International Institute of Analytics is a research and advisory firm that discusses the latest trends and the best practices within the analytics field. We touch on how these strategies are used to build accurate and useful custom data products for businesses.
Kathy breaks down the steps of making analytics more accessible, especially since data products and analytics applications are more frequently being utilized by front-line workers and not PhDs and analytics experts. She uses her experience with a large property and casualty insurance company to illustrate her point about shifting your company’s approach to analytics to make it more accessible. Small adjustments to a data application make the process effective and comprehensible.
Kathy brings some great insights to today’s show about incorporating analytic techniques and user feedback to get the most value from your analytics and the data products you build for the information.
Conversation highlights:
- What is The International Institution of Analytics?
- What is the analytics leadership consortium?
- The “squishy” parts of analytics and how to compensate for them.
- The real value of analytics and how to use it on all levels of a company.
- How beta testers give perspective on data.
- The 3 steps to finding the ideal beta tester.
- Learning from the feedback and implementing it.
- How to keep ROI in mind during your project.
- Kathy’s parting advice for the audience.
Resources and Links:
Thank you for joining us for today’s episode of Experiencing Data. Keep coming back for more episodes with great conversations about the world of analytics and data.
Quotes from today’s episode:
“Oftentimes data scientists see the world through data and algorithms and predictions and they get enamored with the complexity of the model and the strength of its predictions and not so much with how easy it is for somebody to use it.” — Kathy Koontz
“You are not fully deployed until after you have received this [user] feedback and implemented the needed changes in the application.” — Kathy Koontz
“Analytics especially being deployed pervasively is maybe not a project but more of a transformation program.” — Kathy Koontz
“Go out and watch your user group that you want to utilize this data or this analytics to improve the performance.” — Kathy Koontz
“Obviously, it’s always cheaper to adjust things in pixels, and pencils than it is to adjust it in working code.” — Kathy Koo

Nov 21, 2018
Nov 21, 2018
5 min
Hey, everyone. I’m Brian O’Neill and I’m excited to share my new podcast with you called Experiencing Data. I’m a consultant specializing in design and user experience for custom enterprise data products and apps. I’m also the founder and principal of Designing for Analytics.
My goal with this podcast is to expose you to you or rather to other professionals like you. Who is you? Like any good designer, I had a persona in mind when I started designing this podcast. This persona is basically, modeled on my past clients, conversations at data and analytics conferences that I’ve spoken at, and email exchanges with subscribers on my mailing list. My guest and I assume my listeners are usually going to be data product managers, engineering and analytics leaders, data scientists, and executives.
Regardless of the title though, Experiencing Data is really a podcast for business leaders responsible for turning data into useful, usable, and valuable decision support via custom software applications.
Maybe you’re wondering why I’m doing this and I am too a little bit. But here is why, I believe the success of analytics software and data products intended for people, since some of them obviously, don’t have interfaces as many of you probably know is, products that are intended for people are only as good as the experiences that they afford, sometimes I refer to that as kind of the last mile of this large technology projects and products that we put out. Because not all companies have trained designers and UX professionals on staff, I was curious to learn how my guests consider user experience as they design these enterprise data products and software tools.
On this podcast, we’re not going to go deep on design implementation topics such as data viz and user interface design, some of these things are inherently visual, and I think reading about them and seeing examples is more relevant. But more importantly, I want to look more broadly at what I sometimes call Capital D Design. Capital D Design looks more at defining business objectives, user needs, the problem spaces especially, and the success criteria for new products and services.
We’re also going to stay clear off heavy technology discussions since there’s already plenty of that kind of stuff out there and that’s not my area of expertise. Also, on occasion, I may record some solo episodes and share some of my insights on designs that you can put them into play in your daily work. If you’re looking for this kind of insight on a regular basis, you can head over to my Insights mailing list which is at designingforanalytics.com. I write pretty regularly to my list. Feel free to subscribe there if you’re interested in learning more about designing UX.
I’m also a professional percussionist. I’m a professional musician and performing artist. In addition to my design consulting work that I do, I wanted to find a way to bring my two worlds together. I’m going to have occasional episodes with music technologies when it’s relevant to Experiencing Data.
To kick that off, we’re going to have an upcoming episode featuring a guest who’s a product manager, and his name is Julien Benatar, he’s over at Pandora which I’m sure many of you know. He’s going to come in and talk about how Pandora has gone about designing their services analytics platform which is called Next Big Sound, so looking forward to that one. I hope you will be too.
One of the things about podcasting, in general, is ironically how few analytics, we, the publishers and the producers and hosts, receive about our listeners. As those of you on my mailing list already know, I routinely going out and interviewing your customers on a one-on-one fashion; customers, users, whether they’re paying for your software or using an internal tool, I really advocate going out to uncover latent problems they’re having and latent needs that may not be necessarily expressed.
But since the podcast environment though doesn’t let me eat my own dog food and do this type of research since we’re kind of in a one-way broadcast modality, with me speaking and you listening, I hope you’ll leave me feedback, either in iTunes or via email. You can reach me at brian@designingforanalytics.com. This show is my MVP, and I’m sure this show may change over time. If you don’t know what an MVP is, well, stay tuned because we will probably cover that as well.
If this show sounds interesting to you, please head over to iTunes or your favorite podcast app, and click the subscribe button, and then you can join my mailing list at designingforanalytics.com/podcast. That page will be the homepage for this show. Thanks again. I’m Brian O’Neill and welcome to Experiencing Data.